
Dashboard
The Dashboard is the landing page for all users when they log into the Portal. It shows an overview of sales metrics split between Today and the last 7 Days.
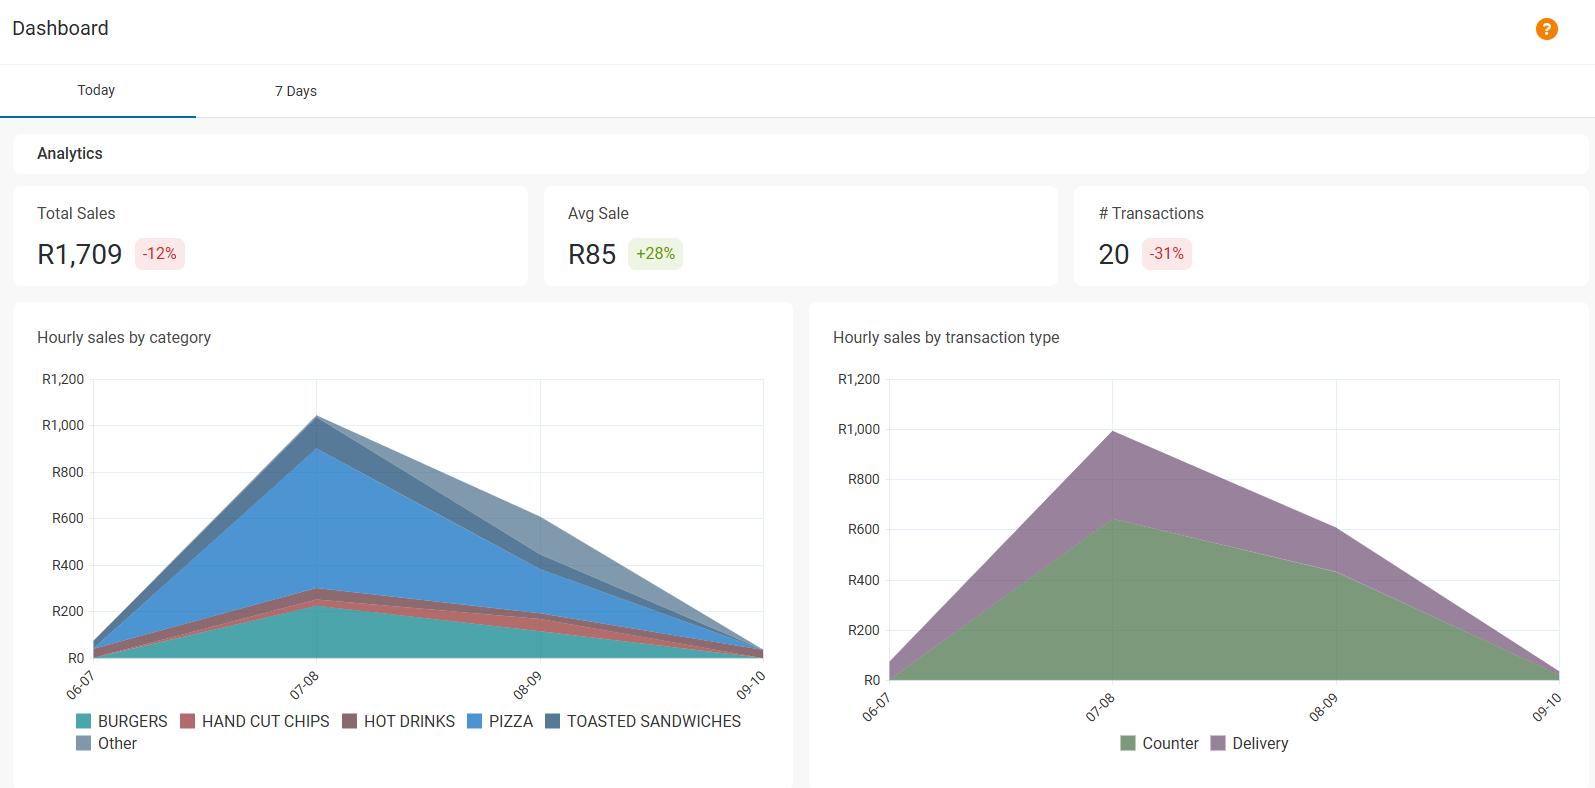
Today
The Today tab shows the sales data starting with the beginning of trade - or in a 24 hour trading store, from the period marked as the Close of Trade time in the store settings (00:00 by default).
Total Sales shows the value of sales until present, then indicates the percentage difference from the same point on the previous day.
Avg Sale is the average value of a single sale, and the percentage difference at the same point on the previous day.
# Transactions shows the number of transactions until present, then indicates the percentage difference from the same point on the previous day.
Hourly sales by category breaks down sales according to their menu category, displayed as a graph where the X axis (vertical) is value and Y (horizontal) is time in hourly intervals. Each category is color coded so the quantities can be compared easily.
Hourly sales by transaction type shows sales split by transaction type (i.e Delivery, Counter, Collect etc.), displayed as a graph where the X axis (vertical) is value and Y (horizontal) is time in hourly intervals.
7 Days
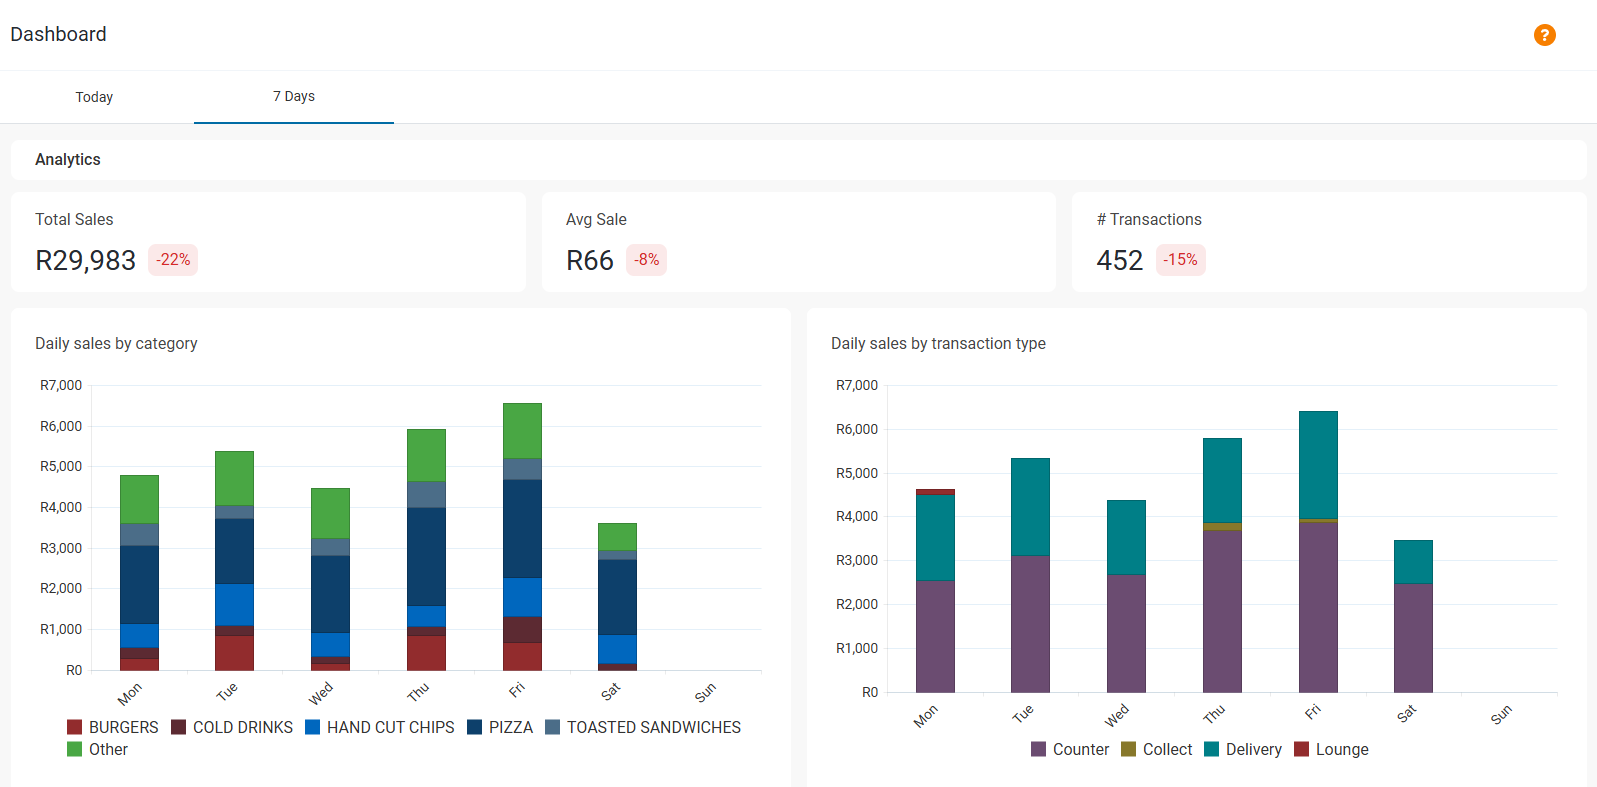
The 7 Days tab shows the sales data of the last seven days of trade.
Total Sales shows the value of sales over the last seven days, then indicates the percentage difference from the same point on the seven-day period.
Avg Sale is the average value of a single sale over the last seven days, and the percentage difference from the same point on the seven-day period.
# Transactions shows the number of transactions over the last seven days, and the percentage difference from the same point on the seven-day period.
Hourly sales by category breaks down sales according to their menu category, displayed as a bar graph where the X axis (vertical) is value and Y (horizontal) is time in daily intervals. Each category is color coded so the quantities can be compared easily.
Hourly sales by transaction type shows sales split by transaction type (i.e Delivery, Counter, Collect etc.), displayed as a graph where the X axis (vertical) is value and Y (horizontal) is time in daily intervals